Creating a Data Exhibit
Read this article to understand how to create a Date Exhibit (Flat Tables and Pivot Tables)
Creating a Data Exhibit (Flat Tables and Pivot Tables)
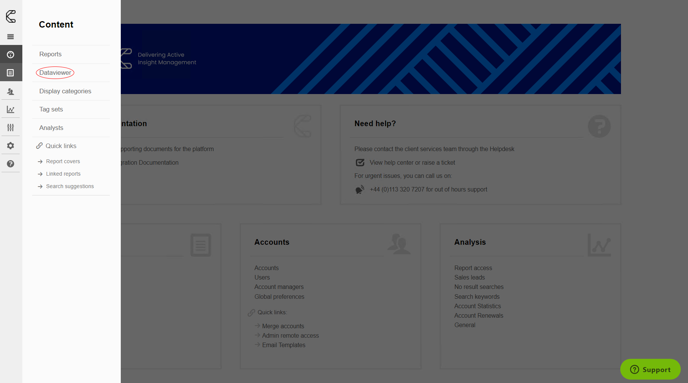
1. Navigate to Admin > Content > Dataviewer.
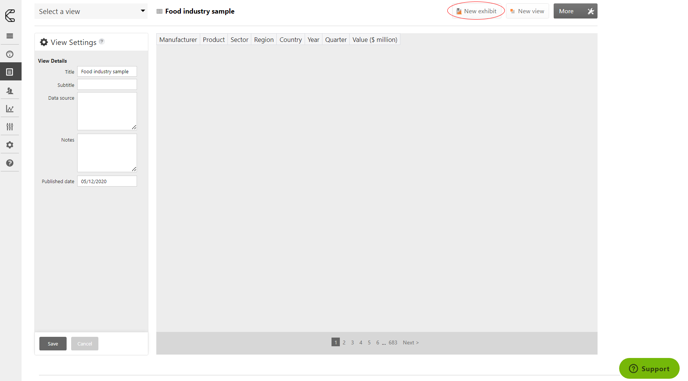
2. Select your data in the Dataviewer section and select New exhibit.
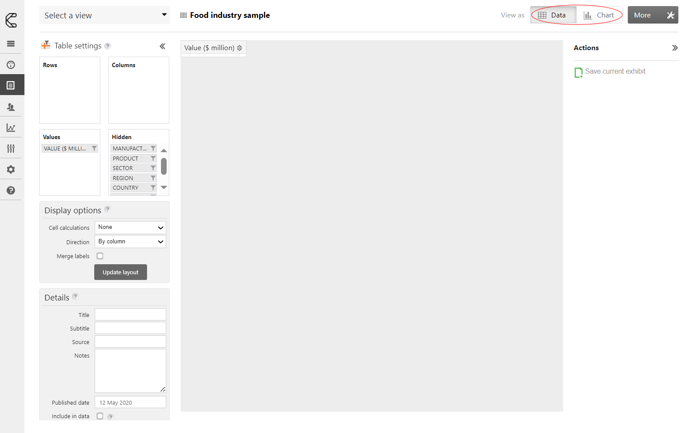
If you wish to create either a flat table or a pivot table, you need to select the Data tab.
2. To create a flat table, drag and drop the required fields from the Hidden section into the Rows section.
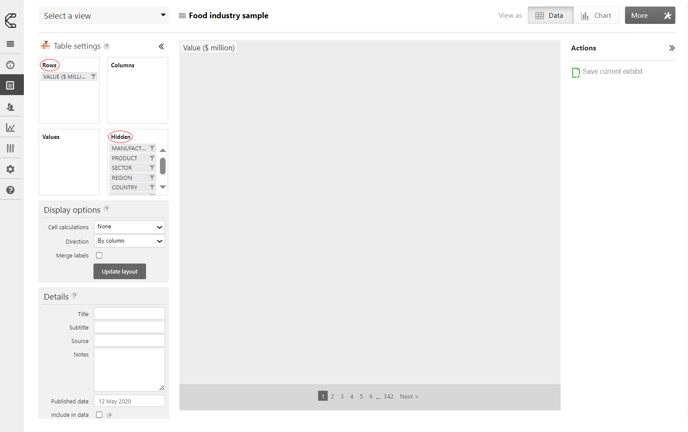
3. To create a Pivot table you will need to move the fields from the Hidden section into either the Rows or Columns section.
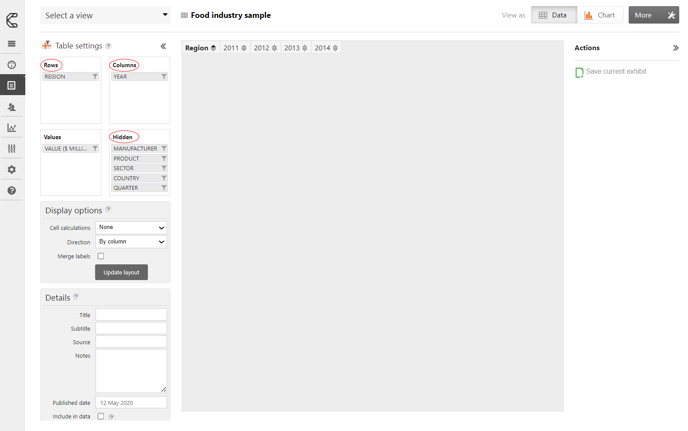
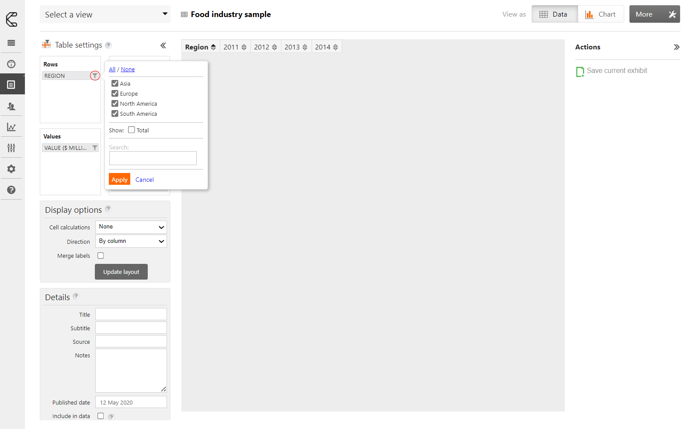
4. You can filter the display by selecting the filter icon next to the field and highlighting the items you wish to display.
.png?width=200&height=89&name=CC%20logo%20blue-1%20(1).png)