.png?width=200&height=89&name=CC%20logo%20blue-1%20(1).png)
Customizing the Chart Color Palette
1. Head to the Admin area > Accounts > Global Preferences.
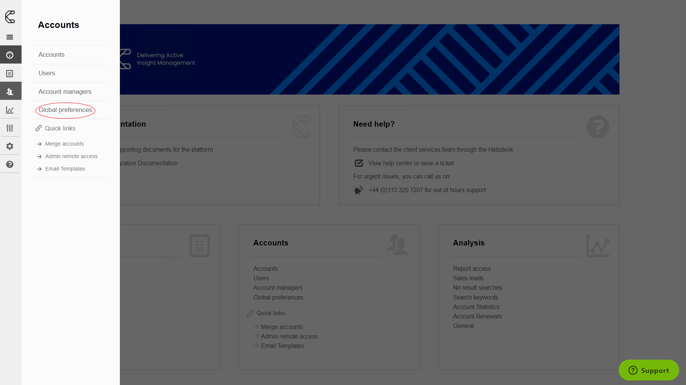
2. In the Preference table, click to expand the Misc section.
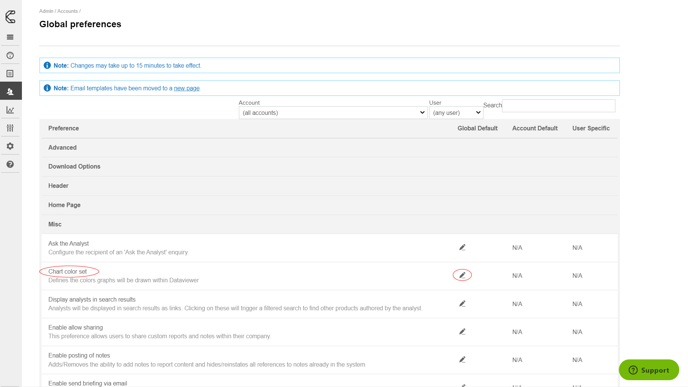
3. Locate Chart color set on the list.
4. Click the Edit icon.
5. Input the desired HTML color (hex) values (e.g. #F03B1E) as a comma separated list.
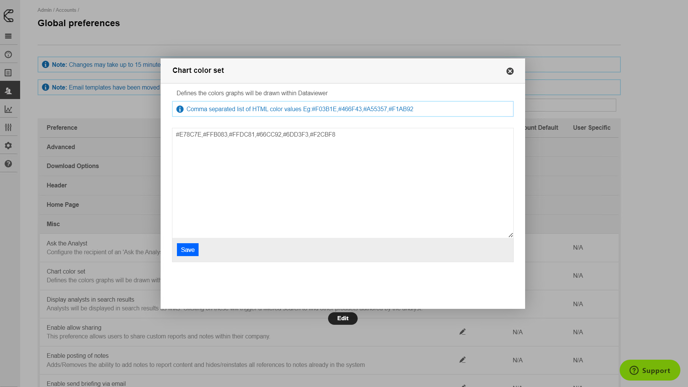
6. Click Save and then Continue.
Now charts within products will display the custom colors.