.png?width=200&height=89&name=CC%20logo%20blue-1%20(1).png)
Read this article to understand:
- Dataviewer features
- How to import a spreadsheet
- How to create a new data view
- How to create a new data exhibit
- Add a data view to a report
- Interact with a data view exhibit
Dataviewer Features
- View analysis side-by-side with interactive data
- Sort, filter, pivot and interact with data embedded within reports
- Generate tailored data views flexibly within an intuitive interface
- Save, copy to clipboard and share custom content with colleagues
- Export directly to Microsoft® Office documents
How to Import an Existing Spreadsheet into Dataviewer
Before importing your spreadsheet, it needs to be formatted as flat data. More about this can be found here.
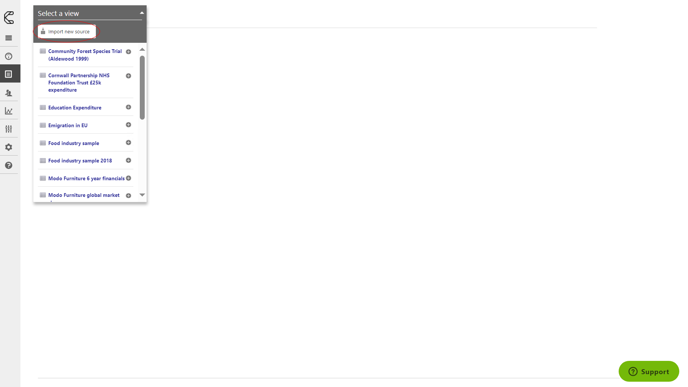
1. Head to Admin > Content > Dataviewer and select the Import new source button from the dropdown menu.
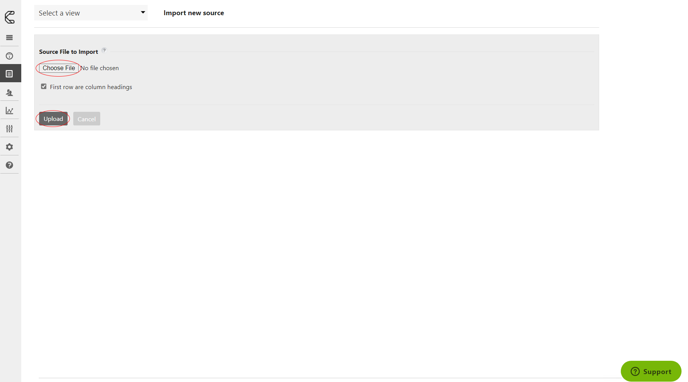
2. Click Choose file and browse to the desired Excel file on your computer.
3. Click Upload.
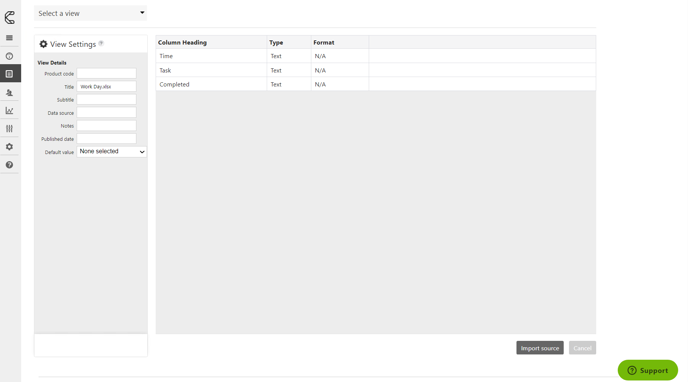
4. Enter descriptive data and click Import table. This will save your spreadsheet to Dataviewer as a table, ready for you to create exhibits. Title and Product code are compulsory.
Creating a new Data View
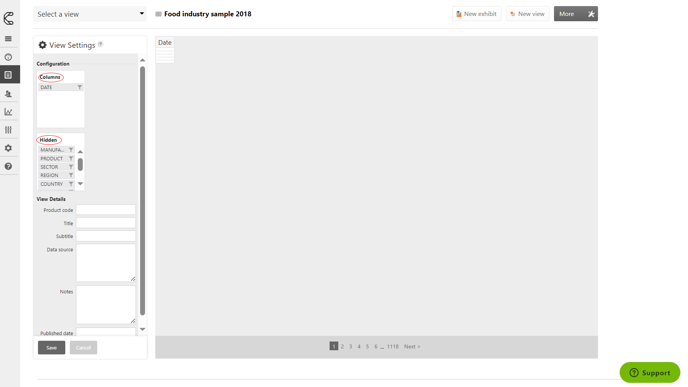
1. Head to Admin > Content > Dataviewer and select title of the table you'd like to configure.
2. Click the New view button.
3. Drag the required columns from Hidden to Columns.
4. Like before, enter descriptive data and click Save.
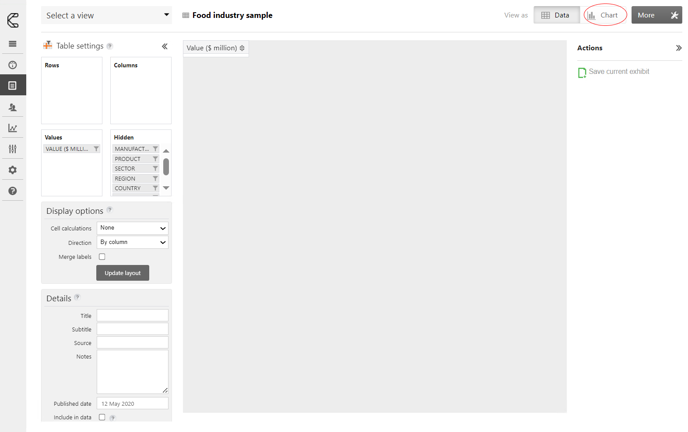
Creating a new Data Exhibit
1. Head to Admin > Content > Dataviewer, select the title of the table you'd like to configure 2. Click the New exhibit button.
3. Drag some data from Hidden to the appropriate ‘Rows’/’Columns’/'Values' boxes.
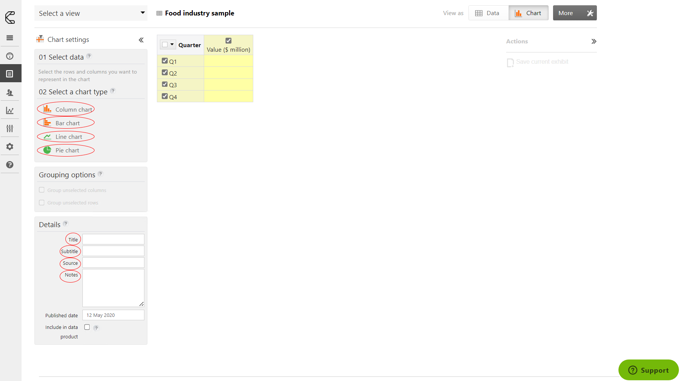
4. To turn this data into an exhibit, click Chart.
5. Select the rows and columns that you would like to be represented in the exhibit.
6. Edit the title and chart type (column, line or pie) as required in Layout options.
7. Add descriptive data to the Chart Info box in the bottom-left.
8. Click Save current exhibit (far right).

Adding your new Data View to a report
1. Go to Admin > Content > Reports.
2. Select the desired report and go into the Content tab.
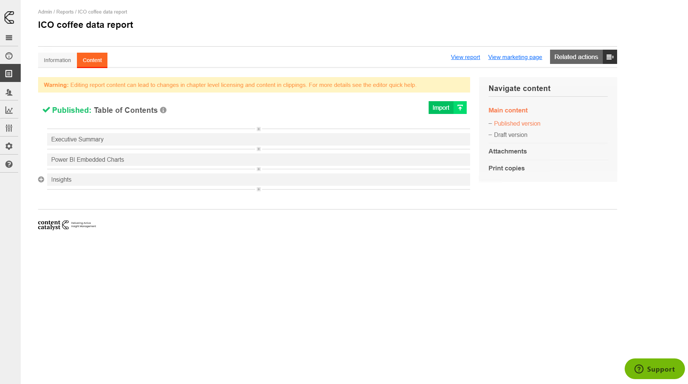
3. Enter the chapter editor interface where you would like to place the exhibit in by clicking on the title.
4. Click on the section you would like to add the exhibit to and select the Embed an exhibit icon on the top toolbar.
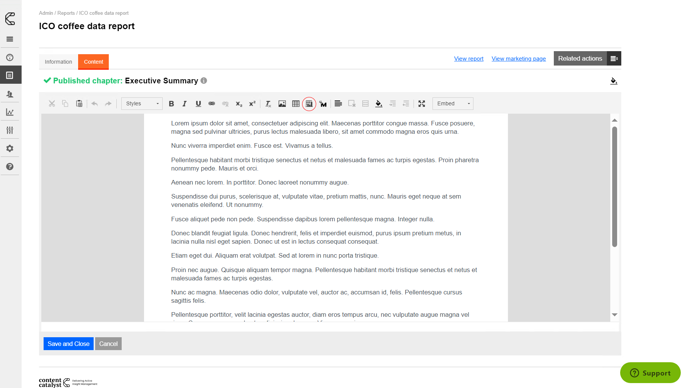
5. Select the required saved exhibit from the drop-down box.
6. Click OK.
7. Save and Close the chapter editor.
Interacting with a Dataviewer exhibit from a report
1. Find the exhibit within the report and hover over the ... icon to expand the options.
2. Click the Interact icon.

3. From here you are free to edit the data selection, chart type and display options. You can then export your exhibit to PowerPoint, save it to your library or add it to clippings.