.png?width=200&height=89&name=CC%20logo%20blue-1%20(1).png)
In Dataviewer, it is possible to add an additional column to include average/totals for the filtered data.
Plotting an average/total column
This is really simple to do, just follow these steps.
- Open your Data set and create a new Exhibit.
- In the Data pivot table view, set up an unfiltered table showing all of the data.
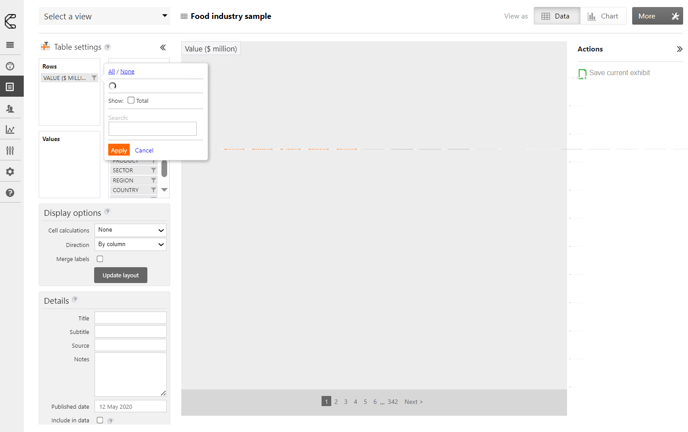
- Click the filter funnel icon for the column or row you'd like to plot an average/total for and tick the Show: Total box.
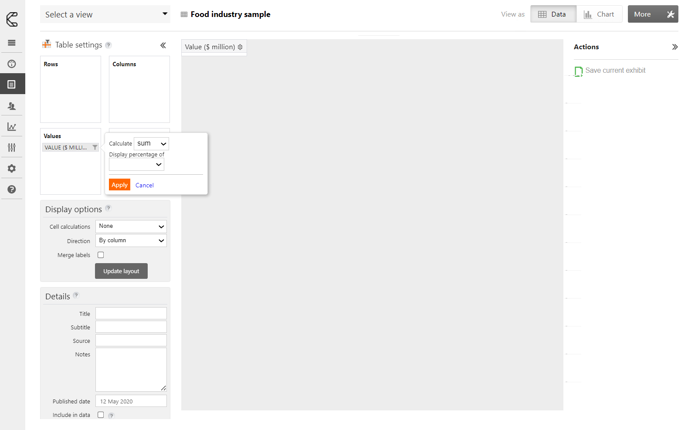
- You can also calculate a sum, mean or count of the data in the Values area by clicking the filter icon.