Embedding MarketSight Exhibits
MarketSight is a survey data visualisation tool that can be integrated into the Content Catalyst platform - learn how to embed survey data exhibits in this article.
Read this article to understand how to:
- Seamlessly deliver survey data to your subscribers
- Weave data exhibits into textual analysis
Your site supports the embedding of MarketSight figures into report chapters.
Below is a comprehensive overview of the process of embedding data exhibits into your textual analysis:
Setting up an Exhibit to embed
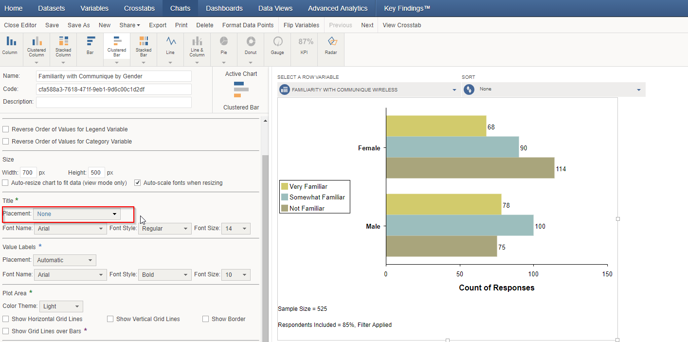
1. Hide the exhibit title to ensure that it is not repeated within the chapter.
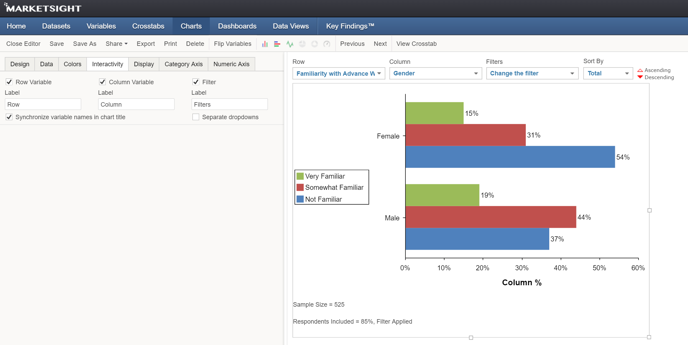
2. Set up your chosen filters or MarketSight variables and save your selections.
Licensing Exhibits
If a user has access to the chapter containing an exhibit they will be able to Single Sign On as the configured MarketSight user.
🔔 We recommend creating a MarketSight user for each dataset.
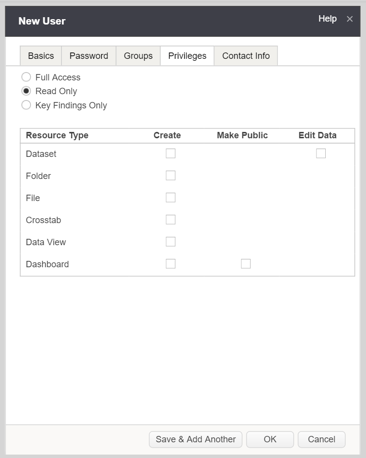
1. When creating a user, ensure that they are created with Read Only privileges.
2. You have the option to configure MarketSight licenses when uploading a dataset.
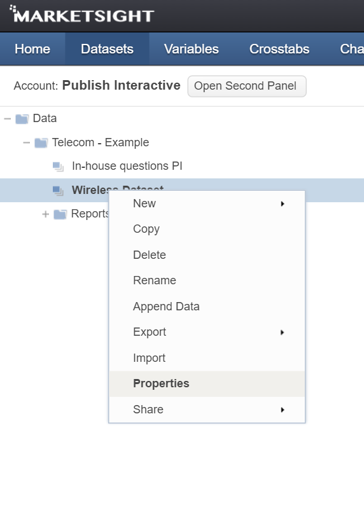
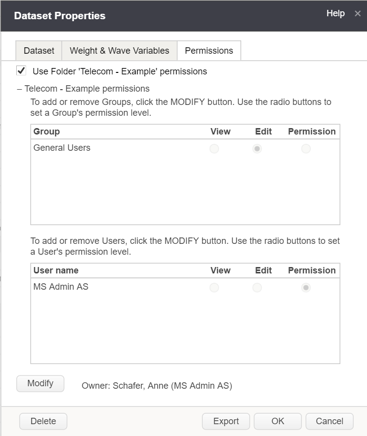
3. You can also do this at any other time by right-clicking on a dataset, selecting Properties and going into the Permissions tab.
Embedding Exhibits
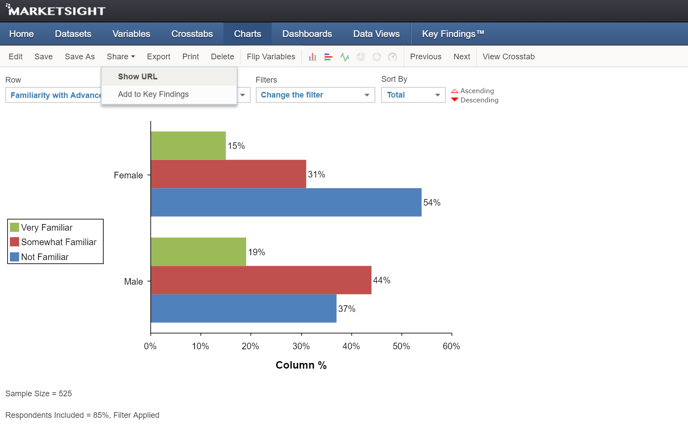
1. In MarketSight, select the chart you wish to embed (tables are not supported), and retrieve the code from the Share Menu.

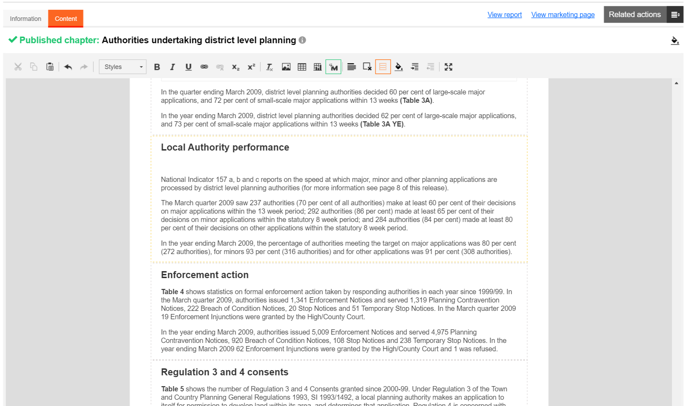
2. On your site, go to the chapter editor and select the paragraph you would like to embed the chart into. Click the Embed from MarketSight button.
3. You will then need to enter the MarketSight credentials (which will be used to Single Sign On a user interacting with the exhibit) as well as the code previously retrieved from MarketSight.
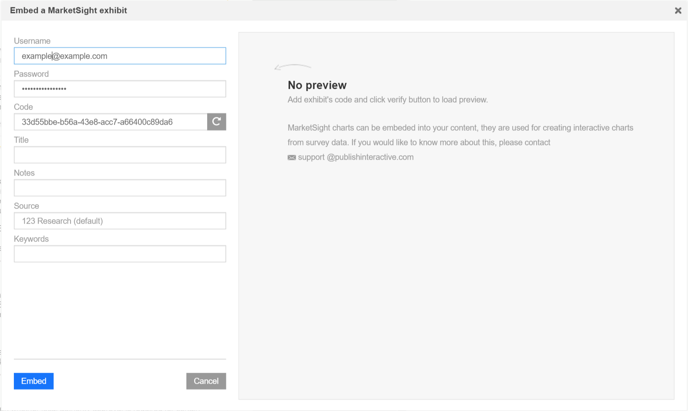
4. You can optionally test if the credentials and exhibit are correct by clicking the  Verify button next to the code.
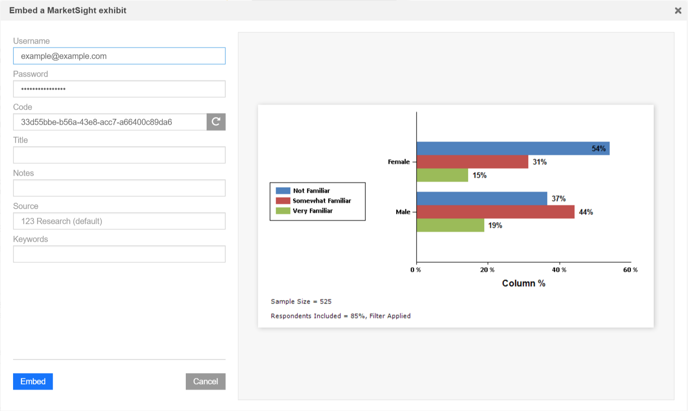
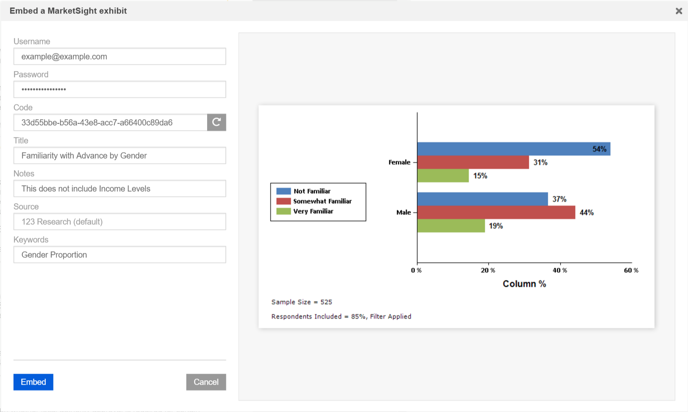
5. Enter the appropriate Metadata and click Embed.
6. Save the chapter.
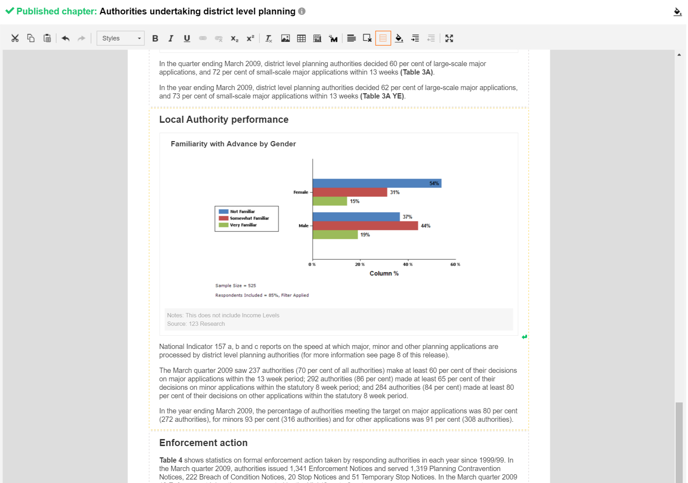
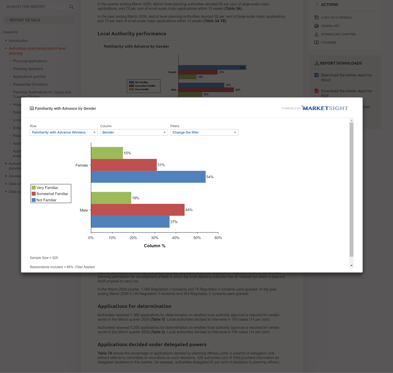
7. You should now be able to view the interactive chart within the report.

.png?width=200&height=89&name=CC%20logo%20blue-1%20(1).png)