.png?width=200&height=89&name=CC%20logo%20blue-1%20(1).png)
Read this article to understand:
- Creating a PowerPoint Report
- Embedding charts and tables for SlideViewer Reports
Creating a PowerPoint report
The process outlined below describes how to create both standard PowerPoint reports and SlideViewer reports. If you have SlideViewer enabled on your site, PowerPoint files will automatically extract with this enhanced functionality.
🚨 The maximum file size limit is 100MB.
1. The first step when adding a new report to the site is creating a report placeholder. Once you've done this, click the Content tab. Then click the Import button on the right.
2. To import your report you can click to browse or drag and drop. A message will pop up, warning you that uploading this PowerPoint will remove any previous main content uploaded.

3. This will then automatically make the report available through the online viewer. For large PDFs there will be some processing time. This extraction will continue in the background if you leave this page to complete other tasks.

4. Once completed, you can select the View report link to see what licensed end users will see. Users will be able to download the report in PowerPoint format and interact with the content within the PDF and Slide Viewer.
You can also add chapters, to organise report pages, through the interactive table of contents editor.


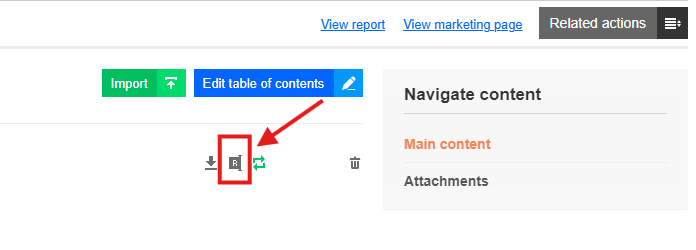
5. You can amend the report file by selecting Edit source file. If you wish to make the PowerPoint available to download only (and not viewable online), deselect the arrow icon shown alongside the source file. Here, you can also rename the source file with the rename icon.

Embedding charts and tables for SlideViewer Reports
When adding charts into PowerPoint it is important to ensure that data is embedded in the file. This can be done by selecting the appropriate option when copying and pasting charts into your PowerPoint presentation. This option is usually "Keep Source Formatting & Embed Workbook". For tables, either "Use Destination Styles" or "Keep Source Formatting" will work.

